Note
Go to the end to download the full example code.
Diagnostics prior to eddy detection#
Initialisations#
Import needed stuff.
import cmocean as cm
import matplotlib.pyplot as plt
import xarray as xr

from shoot.dyn import get_geos, get_lnam, get_okuboweiss
from shoot.grid import get_dx_dy
from shoot.plot import create_map, pcarr
from shoot.samples import get_sample_file

xr.set_options(display_style="text")
<xarray.core.options.set_options object at 0x70269976bf90>
Read data
Compute grid metrics only once
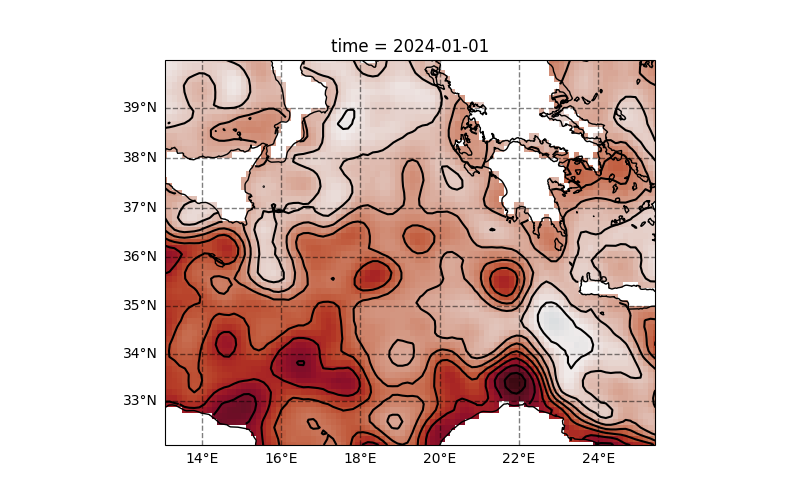
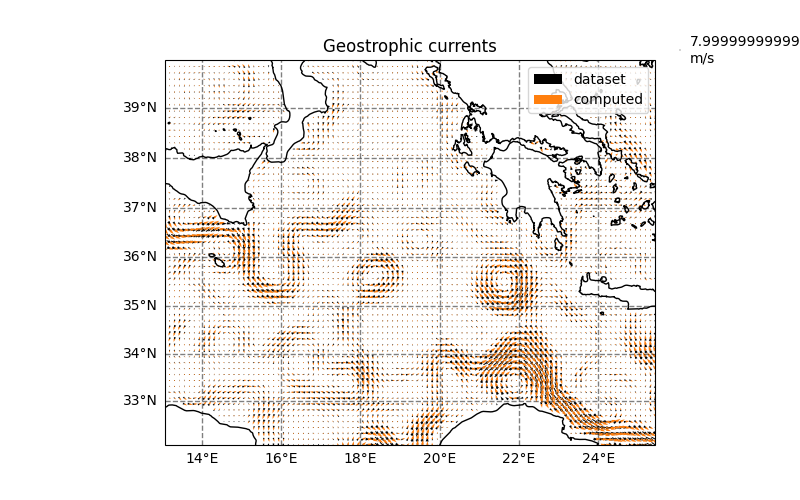
Geostrophic currents#
ADT
fig, ax = create_map(ds.longitude, ds.latitude, figsize=(8, 5))
ds.adt.plot(ax=ax, cmap="cmo.balance", add_colorbar=False, transform=pcarr)
ds.adt.plot.contour(ax=ax, transform=pcarr, colors="k", levels=20)
<cartopy.mpl.contour.GeoContourSet object at 0x7026992a4e90>
Compute gestrophic current
Compare them to dataset currents
fig0, ax0 = create_map(ds.longitude, ds.latitude, figsize=(8, 5))
kwqv = dict(units="dots", width=1, scale_units="dots", scale=1 / 20, transform=pcarr)
ds.plot.quiver(x="longitude", y="latitude", u="ugos", v="vgos", color="k", ax=ax0, label="dataset", **kwqv)
ax0.quiver(
    ds.longitude.values,
    ds.latitude.values,
    ugeos.values,
    vgeos.values,
    color="tab:orange",
    label="computed",
    **kwqv,
)
plt.title("Geostrophic currents")
plt.legend()
<matplotlib.legend.Legend object at 0x7026992b41d0>
Local normalized angular momentum#
The normalized angular momentum is computed at the center of 2D scanning window.
Window in km
window_lnam = 50
Local normalized angular momentum
Plot
fig1, ax1 = create_map(ds.longitude, ds.latitude, figsize=(8, 5))
lnam.plot(cmap=cm.cm.diff, ax=ax1, add_colorbar=False, transform=pcarr)
plt.title(f"Local angular momentum [{window_lnam}km]")
![Local angular momentum [50km]](../_images/sphx_glr_plot_diags_prior_eddies_003.png)
Text(0.5, 1.0, 'Local angular momentum [50km]')
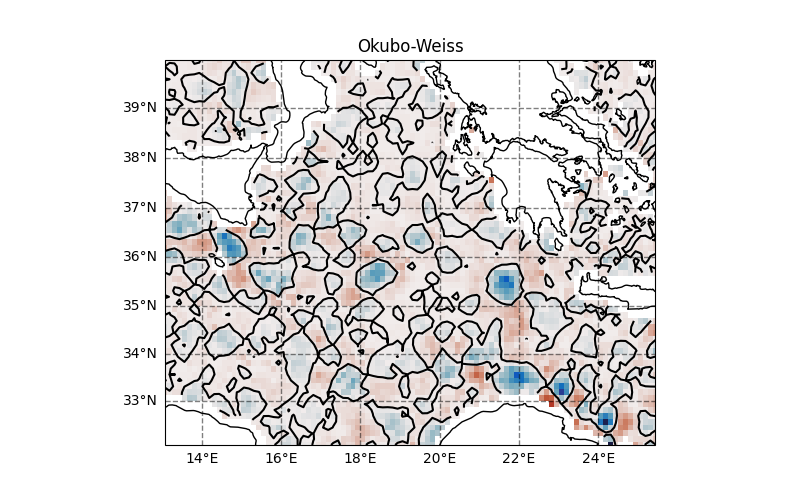
Okubo-Weiss#
Diagnostic
Plot
fig2, ax2 = create_map(ds.longitude, ds.latitude, figsize=(8, 5))
ow.plot(cmap=cm.cm.balance, ax=ax2, add_colorbar=False, transform=pcarr)
ow.plot.contour(levels=[0], colors="k", transform=pcarr, ax=ax2)
plt.title("Okubo-Weiss")
Text(0.5, 1.0, 'Okubo-Weiss')
Total running time of the script: (0 minutes 1.217 seconds)